Looking at a product’s surface profile reveals irregularities seen as peaks and valleys in varying heights, depths and spacing, known as surface texture. Any production process – such as casting, machining, grinding, and forming – has an impact on surface texture. In machining, for example, both the interaction of the cutting edges and the microstructure of the material being cut contribute to the final surface texture.
Surface texture includes the attributes of form, lay, waviness, roughness and flaws. Form is the physical shape of a surface and lay is the primary direction of the production process. Waviness and roughness are seen as the peaks and valleys, with waviness being the widely spaced wavelengths and roughness are the shortest spaced wavelengths inside both ends of waviness. Flaws are random irregularities found on the surface.
While lay, flaws, waviness and form impact surface texture, surface roughness is most often used to define the surface finish or texture required on a completed product. The acceptable surface roughness is typically specified on a drawing or print as the Ra value. Different parts of a product may have different Ra requirements and prints may have more than one Ra specified.
The mean arithmetical value of the roughness profile defined on the sampling length is represented using a single numeric parameter, Ra. Occasionally referred to as tooling marks, surface roughness is measured transversely to the direction of the finish pattern or lay using specialized equipment such as a profilometer or interferometer.
The Ra value is calculated using the average height of the peaks and valleys measured from the center line across the standard length. Different standards use different standard lengths to measure Ra.
Ra values are commonly represented either in micrometers (µm) or microinches (µin). ISO standards use the term CLA (Center Line Average) to represent average surface roughness. Both Ra and CLA are interpreted identically.
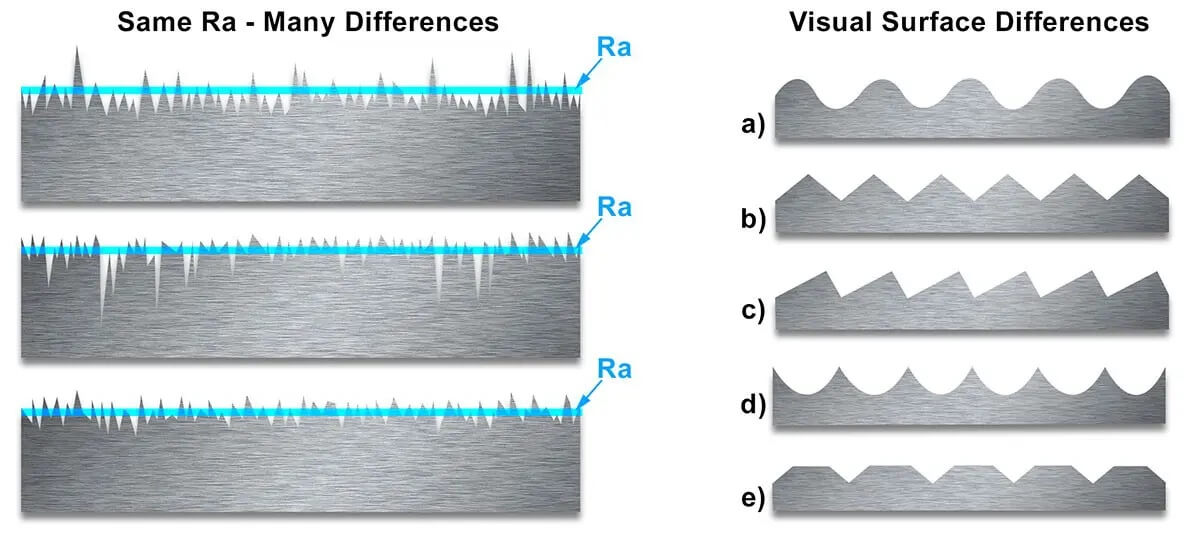
Although Ra is a useful average, it does not differentiate between peaks and valleys. Very different profiles can have the same Ra value. The surface roughness chart below demonstrates the visual differences in peaks and valleys with the same Ra.

In technical specification, the upper limit or maximum value of the parameter is often found during inspection. For requirements specified by the upper limit of a parameter, the surface is considered acceptable if not more than 16% of all measured values of the selected parameter. The more complicated the shape of the surface, the more critical the function of the surface, the more sophisticated we need to be in measuring parameters beyond Ra.
ISO 9001:2015 certified and FFL licensed, ISO Finishing is an expert in creating customized, documented and repeatable isotropic surface finishing processes. We are experienced in working with all material types and our surface finishes meet the strictest requirements.
The best way to show you first-hand how our finish will be your finish is to process your sample. Let us show you what we can do.
LET’S GET IT FINISHED.